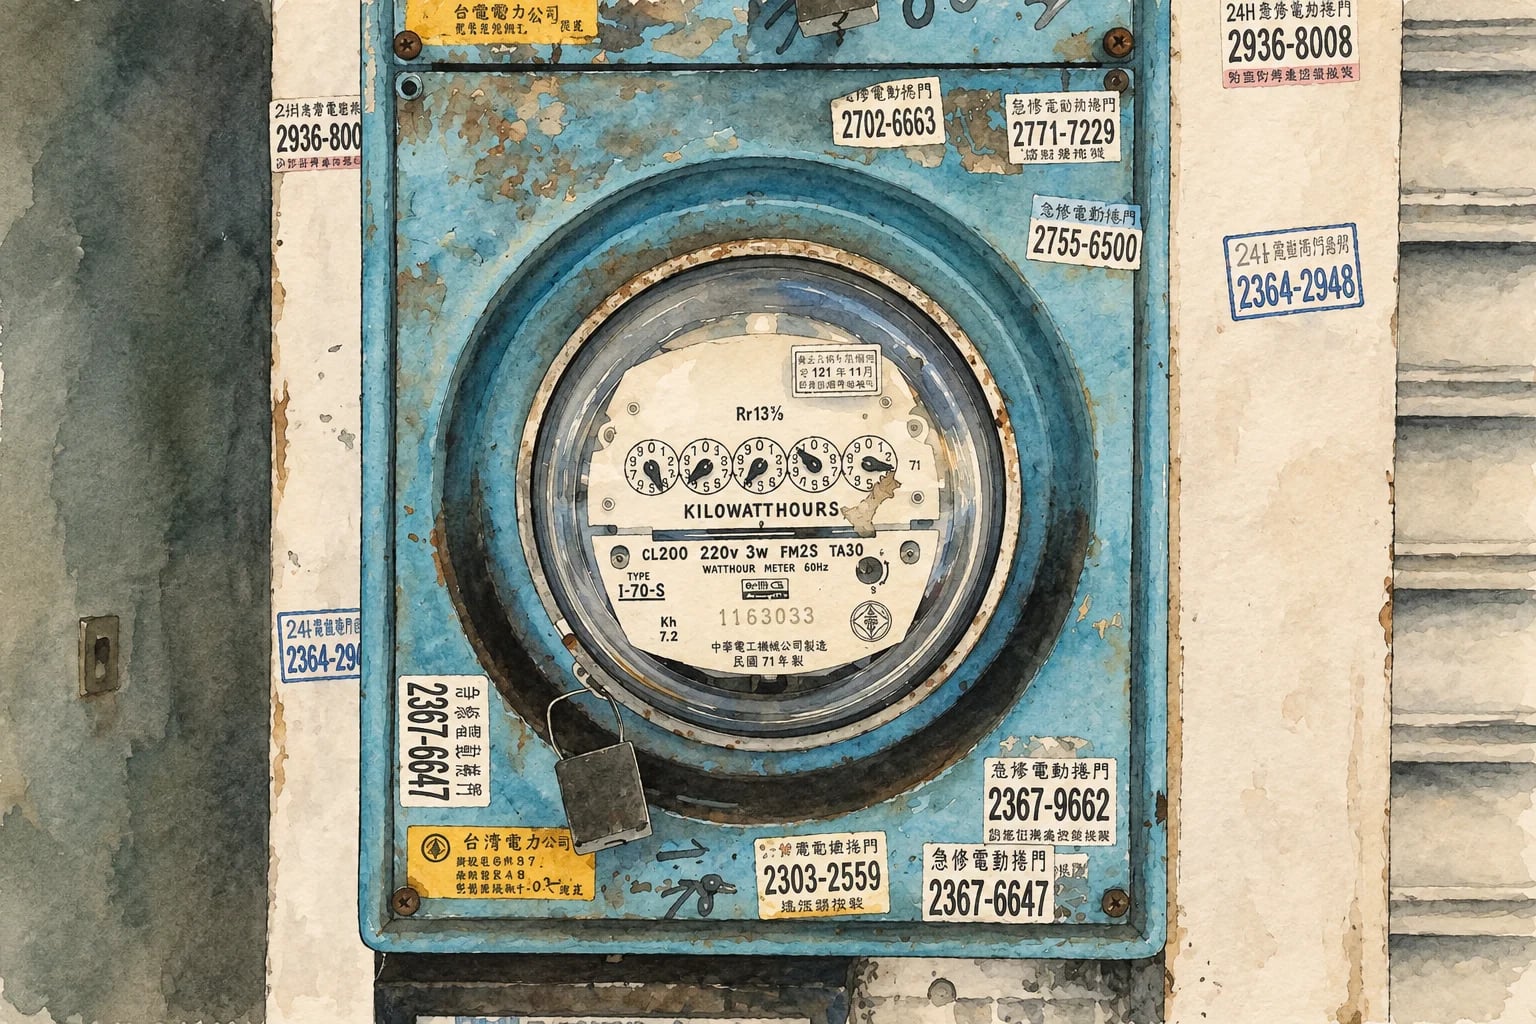
Household Peak-Shaving, Load-Shifting, and Standby Load Reduction
The Prius Effect at Home
Some time ago I read a magazine article about something called the Prius effect.[3]
The idea was that giving drivers frequent, accurate, and readily accessible feedback about their own vehicle's fuel economy could actually change the way they drove. The early Prius made miles per gallon (mpg) feedback visible right on the car's dashboard, updating in real time as it was driven.
One particularly committed group of Prius owners even started calling themselves hypermilers and curated a number of methods to optimize MPG to the extreme. They'd drive on the painted lines of the road to reduce rolling resistance, modify their cars to reduce aerodynamic drag, and draft semi-trailers to mitigate air resistance.[3]
All of this to say, good feedback in this case was credited with influencing behaviors that generally improved fuel efficiency.
Research into household energy consumption and user feedback generally trends the same way. Review of the literature finds that feedback works best when it's frequent, sustained, clearly presented, and broken down by individual appliances.[1][2]
The Prius Effect was a bit of an inspiration to me in my own journey in learning how I might be able to influence the energy consumption behaviors for myself and my family. And if we could identify behaviors that had the intended result of lowering our overall energy consumption, there might be opportunities there to automate those operations throughout our household so that the savings wouldn't just be dependent on habits, but on well-devised automated systems.
The first step in that journey was to determining the validity of some commonly held myths around household energy consumption.
Home Energy Myths
Each of these is a claim I had heard or believed about household energy use. Make a guess first, then see what the evidence says.
Myth
Turning household electronics off and back on again actually consumes more energy than simply leaving them on all the time.
Myth
Standby load (or vampire load) doesn't typically account for a significant share of a household's average electrical demand.
Myth
Repeatedly switching a device on and off can significantly shorten the life of the device.
Myth
The carbon footprint, energy use, and cost of energy monitors and smart switches can scarcely be recovered by what they may save in a household through automations.
Mapping the Panel
We live in a 1909 Italianate, and over the years the electrical system has become something of a mystery. Wires crisscross the basement joists, and the relationship between the breakers in the panel and the individual outlets, light fixtures, and appliances throughout the house has been lost to the annals of time.
Before going any further with our energy-savings ambitions, I needed to map our panel.
The result is the map below.
Collecting Household Energy Data
I had five years of Duke Energy bills, so I already had a historical record of how much electricity and natural gas the house had used.
I pulled that information into a spreadsheet, giving me monthly consumption going back several years.
But that data had the same limitation as the utility bill itself: it told me how much energy we had used, but not where it had gone.
It was a little like someone trying to lose weight by counting calories. If you're trying to understand your diet, knowing your total calorie consumption is useful, but eventually you need to know where those calories are coming from.
I needed the same thing for the house. I wanted to understand what proportion of our household's energy budget was being spent on different systems and activities.
How much was the HVAC system using? How much was the water heater? How much was the dryer? How much was simply the collection of smaller electrical loads that are always running?
The utility bills couldn't answer those questions.
For this part of the project, I wasn't starting from scratch.
I run Home Assistant locally on a Raspberry Pi, and over the last several years it's grown into a fairly extensive home automation system. Lights, switches, cameras, and sensors are spread throughout the house. I have automations that decide when things turn on and off, report on our environment, and even turn the house red when the Reds win a home game.
But I was missing a few things. I needed accurate environmental and electrical data, and I didn't have either. At the time we had no whole-house electrical monitor, no smart thermostat, and no room-level temperature and humidity sensors. So I needed to figure out the lowest cost of entry for each of them.
I started with the electrical side and went one level deeper than the bill, with an Emporia Vue 3 home energy monitor in the breaker box.
This is the same kind of appliance-level breakdown that the research identifies as one of the most effective forms of feedback. Fischer's review found that the most successful feedback is frequent, sustained over a long time, broken down by appliance, and presented clearly.[1]
The utility bill essentially told me:
Energy in, with no breakdown of where it went.
The energy monitor could start telling me what was happening inside that box. I didn't just want to know that we had used a certain number of kilowatt-hours that month. I wanted to understand the individual electrical loads that made up that number, when they were running, and how much electricity they were consuming.
Installing the Emporia Vue 3
I read the installation directions for the Emporia Vue 3, and everything made sense except one detail. Even after you flip all the breakers, including the main, and remove the front cover of the panel, two bolts inside are still energized. Those are the lugs where the utility feed connects to the panel, which sits upstream of the main breaker, so shutting off the main doesn't touch them. As long as you don't touch those bolts and die, installation should be a breeze.
I did talk to an electrician, who said I should be fine to install it myself as long as, you know, I didn't touch those bolts.
It still took me several hours. Along the way I put the front cover back on a few times, did more reading and YouTube watching, and came back only after I was sure I understood the next step.
Luckily, since I'd already mapped the breakers, setting up the software was super easy. Integrating it with Home Assistant was just as simple. Some users flash the device so Home Assistant can get more frequent updates on energy use, but for now I'm sticking with the stock app, which is fine for my purposes.
The goal wasn't simply to collect more data. It was to be able to take the household's total electrical consumption and start breaking it apart into something I could actually reason about.
Collecting Household Environment Data
With the electrical side covered, I still needed to know what was going on with the temperature and humidity in each room, and what the HVAC system was doing about it.
I experimented with some inexpensive Sonoff temperature and humidity sensors, but I wasn't particularly happy with them. I eventually discovered the world of inexpensive 433 MHz sensors and software-defined radio. With an SDR dongle and the open-source rtl_433 decoder,[5] I could receive data from inexpensive wireless temperature and humidity sensors throughout the house and pass it into Home Assistant over MQTT.[6]
I bought an SDR for roughly $50, including its antenna, and then purchased inexpensive sensors at roughly $15 each. I put sensors in the rooms throughout the house and one outside.
For the outdoor sensor, I even 3D-printed a small enclosure to keep direct sunlight off of it and provide some shelter. I wanted a reasonable measurement of the ambient outdoor temperature and humidity rather than a sensor sitting in direct sunlight and reporting something that wasn't representative of the actual outdoor conditions.
I also purchased an Ecobee smart thermostat.
I integrated all of those sensors into Home Assistant and started building a dashboard.
That gave me my first real environmental dataset.
I could see temperature and humidity for each room. I could calculate daily highs and lows, and I could calculate dew point from temperature and humidity. I could also see how often the air conditioning was running, along with the thermostat's set temperature.
That distinction between raw data and calculated data was important.
The temperature and humidity sensors were giving me raw measurements. From those measurements, I could calculate things like daily highs and lows and dew point. The HVAC system and thermostat were giving me additional raw data about runtime and the temperature I was asking the system to maintain.
I could then compare those things against one another. The outdoor sensor gave me a baseline for the conditions outside.
Once I had that data, I started building different ways of looking at it.
At first I experimented with trying to reduce everything to a single number, almost like the Moneyball idea:[7] is there some metric that can summarize all of this information and make the important patterns easier to see?
I found some existing calculations that attempted to quantify human comfort by combining temperature and humidity. Some of them were based on surveys of people's reported comfort under different environmental conditions.
But ultimately, I didn't find that particularly useful for what I was trying to understand.
What I really cared about was much simpler.
Was the humidity somewhere around 30 to 50 percent?[4] Was the temperature around 72 degrees? And were those conditions reasonably consistent throughout the house?
I started creating delta views to make those comparisons easier.
One view compared the temperature in each room with the outdoor temperature. Another compared the temperature in each room with the thermostat's set temperature.
That second comparison was particularly useful because it let me see which rooms were outliers.
Instead of looking at a collection of individual temperature readings, I could quickly see how far each room was from the temperature the thermostat was actually trying to maintain.
At this point, I wasn't trying to draw conclusions or change anything.
I was still trying to answer a much more basic question:
What data do I actually need to understand what's happening in my house?
References
Sources for the feedback research and the open-source tools behind this project.
- Fischer, Corinna. (2008). Feedback on household electricity consumption: a tool for saving energy?. Energy Efficiency 1(1), 79–104 [Link]
- Darby, Sarah. (2006). The Effectiveness of Feedback on Energy Consumption: A Review for DEFRA of the Literature on Metering, Billing and Direct Displays. Environmental Change Institute, University of Oxford [Link]
- Ross, Jim. (2014). Information Displays That Change Driver Behavior. UXmatters, July 7, 2014 [Link]
- U.S. Environmental Protection Agency. Mold Course, Chapter 2: Why and Where Mold Grows. EPA (January 2025 snapshot) [Link]
- Benjamin Larsson and contributors. rtl_433: Generic data receiver for ISM-band devices. GitHub [Link]
- Pavel Khrulev. rtl_433 MQTT auto-discovery add-on for Home Assistant. GitHub [Link]
- Lewis, Michael. (2003). Moneyball: The Art of Winning an Unfair Game. W. W. Norton
- Meier, A. and Rosen, K.. (1999). Leaking Electricity in Domestic Appliances. Lawrence Berkeley National Laboratory (Proceedings of the 50th International Appliance Technical Conference)
- Ross, J.P. and Meier, A.. (2000). Whole-House Measurements of Standby Power Consumption. Lawrence Berkeley National Laboratory
- Rainer, L., Greenberg, S., and Meier, A.. (1996). You Won't Find These Leaks with a Blower Door: The Latest in 'Leaking Electricity' in Homes. ACEEE Summer Study on Energy Efficiency in Buildings
- Carriere, L. and Rea, M.. (1988). Economics of Switching Fluorescent Lamps. IEEE Transactions on Industry Applications, 24(3)
- Zhang, W. and colleagues. (2024). A Hardware-in-the-Loop Experimental Testbed using Air Conditioners for Grid Balancing. arXiv:2411.11893 [Link]
- Delforge, P.. (2015). Home Idle Load: Devices Wasting Huge Amounts of Electricity When Not in Active Use. Natural Resources Defense Council
- Natural Resources Defense Council. Home Idle Load Self-Diagnosis and Action Guide. NRDC
- Escobar, L.A. and Meeker, W.Q.. (2006). A Review of Accelerated Test Models. Statistical Science, 21(4) [Link]
- Pinheiro, E., Weber, W.-D., and Barroso, L.A.. (2007). Failure Trends in a Large Disk Drive Population. 5th USENIX Conference on File and Storage Technologies (FAST '07)
- U.S. Department of Energy. Energy Saver guidance on LED lighting. energy.gov
- Scientific American. (2024). Does Turning Fluorescent Lights Off Use More Energy Than Leaving Them On?. Scientific American
- Delmas, M.A., Fischlein, M., and Asensio, O.I.. (2013). Information strategies and energy conservation behavior: A meta-analysis of experimental studies from 1975 to 2012. Energy Policy, 61, 729-739
- Ehrhardt-Martinez, K., Donnelly, K.A., and Laitner, J.A.. (2010). Advanced Metering Initiatives and Residential Feedback Programs: A Meta-Review for Household Electricity-Saving Opportunities. ACEEE Report E105
- Houde, S., Todd, A., Sudarshan, A., Flora, J.A., and Armel, K.C.. (2013). Real-time feedback and electricity consumption: A field experiment assessing the potential for savings and persistence. The Energy Journal, 34(1), 87-102
- Energies. (2025). Advances in Reducing Household Electrical and Electronic Equipment Energy Consumption in Standby Mode: A Review of Emerging Strategies, Policies, and Technologies. Energies, 18(4), 965
- Energy Efficiency. (2021). Real-time feedback on electricity consumption: evidence from a field experiment in Italy. Energy Efficiency